Overview
The following report was compiled using San Francisco Pride Parade 2013 dispatch notes. The purpose of this document is to socialize the scope & weight of providing Emergency Medical Services Dispatch at an event of this magnitude.
Background
The San Francisco Lesbian, Gay, Bisexual, and Transgender Pride Celebration is a parade and festival held in San Francisco every June. Event organizers were anticipating a record 1.2 million attendees to 2013's Pride event, an increase of 200,000 from the four previous years. 2013's attendance increase was primarily due to recent judiciary victories with the repeal of California's Proposition 8 (Prop. 8) and the unconstitutionality of the Federal Defense of Marriage Act (DOMA) in the days leading up Pride. Additionally, San Francisco was experiencing exceptionally warm summer weather the weekend of Pride.
Prior to 2013, Pride Emergency Medical Services were provided by volunteers, administered by the 'San Francisco Lesbian, Gay, Bisexual, Transgender Pride Celebration Committee' and under their direct control. For 2013 HealthRIGHT360's Rock Medicine program was brought in to administer Emergency Medical Operations using a combination of their volunteers and existing Pride administration volunteers. Rock Med was selected because of its ability to provide Advanced Life Support field care without burdening the existing San Francisco County Emergency Medical System.
Analysis of Event
The following statistics were collected on Field Team activities using dispatch notes & Field Supervisor post-event interviews. These statistics are relative only to the Sunday, June 30th Pride Parade.
- Pride Attendance: 1.2 million (estimated)
- Population of San Francisco: 825,863
- Medical Calls Received at Dispatch: 118
- Medical Patients Treated: 103
- Medical Staff: 80
- Medical Field Teams: 14
- Medical Transport Units: 5 - 3 BLS, 2 ALS.
- Medical Dispatchers: 3
- Standby ALS Ambulances: 3
- Medical Radio Channels: 3 - 2 Dispatch (1 Repeated, 1 Simplex), 1 Talk-Around.
- Medical Field Supervisors: 2
- Medical Commanders: 2
- Shootings: 2
- Fires: 1
- Field Hospitals: 1 ALS Field Hospital & Sobering Center.
- Duration of event: 10:00 AM to 7:00 PM (9 Hours).
Summary of Event
The following ratios are based on the statistics from the section above and are approximate or average.
- Peak Call Hour: 3PM - 22 Calls.
- Busiest Transport Team: Transport 3 (TP3) @ 15 Calls.
- Busiest Field Team: Team 13 (T13) @ 10 Calls.
- Average Call Load: 13 calls per hour, or 1 call every 4 minutes.
- Average Calls Per Team: 6
- Average Calls Per Radio Channel: 59
- Average Teams Per Radio Channel: 9.5
- Teams Per Attendee: 1:631571
- Calls Per Attendee: 1:10169
- Patients Per Attendee: 1:11650
- Medical Staff Per Attendee: 1:15000
Charts
Key:
- T: Field Team - 2+ BLS.
- TP: Transport Team - 2 BLS.
- S: Field Supervisor - 1+ BLS.
- C: Medical Command - 1 ALS.
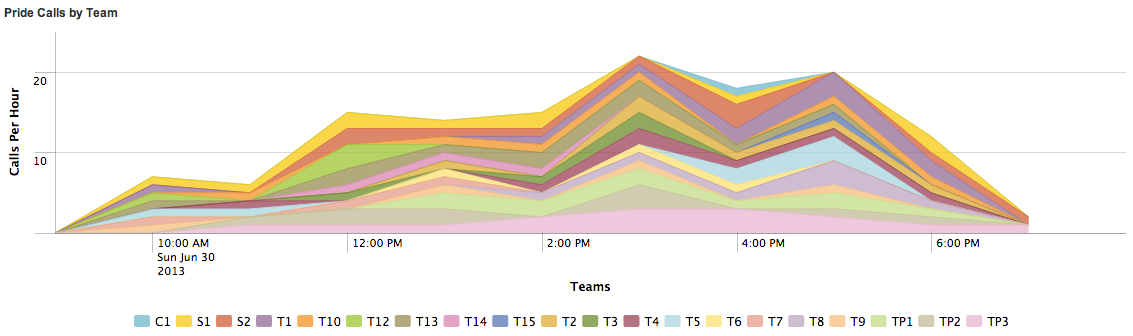
By Time
The following chart shows Calls by Team over time, bucketed by the hour. This graph shows call-load peaking around 3PM:
By Team
The following chart shows the 10 Busiest Teams, with the transports having the heaviest call load, followed by T13, T1 and S1 & S2:
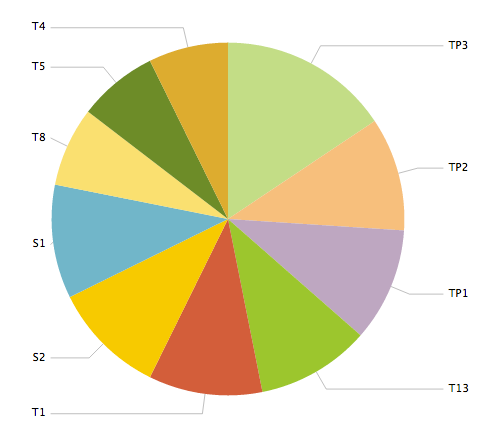
| Team | Number of Calls | Percent of Calls |
|---|---|---|
| TP3 | 15 | 11% |
| TP2 | 10 | 8% |
| TP1 | 10 | 8% |
| T13 | 10 | 8% |
| T1 | 10 | 8% |
| S2 | 10 | 8% |
| S1 | 10 | 8% |
| T8 | 7 | 5% |
| T5 | 7 | 5% |
| T4 | 7 | 5% |
The following chart shows call-load by all teams:
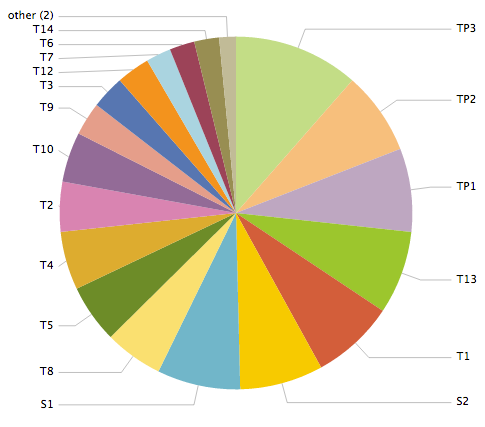
| Team | Number of Calls | Percent of Calls |
|---|---|---|
| TP3 | 15 | 11% |
| TP2 | 10 | 8% |
| TP1 | 10 | 8% |
| T13 | 10 | 8% |
| T1 | 10 | 8% |
| S2 | 10 | 8% |
| S1 | 10 | 8% |
| T8 | 7 | 5% |
| T5 | 7 | 5% |
| T4 | 7 | 5% |
| T2 | 6 | 5% |
| T10 | 6 | 5% |
| T9 | 4 | 3% |
| T9 | 4 | 3% |
| T3 | 4 | 3% |
| T12 | 4 | 3% |
| T7 | 3 | 2% |
| T6 | 3 | 2% |
| T14 | 3 | 2% |
| T15 | 1 | 1% |
| C1 | 1 | 1% |
By Location
The following map shows Call Density by Location:
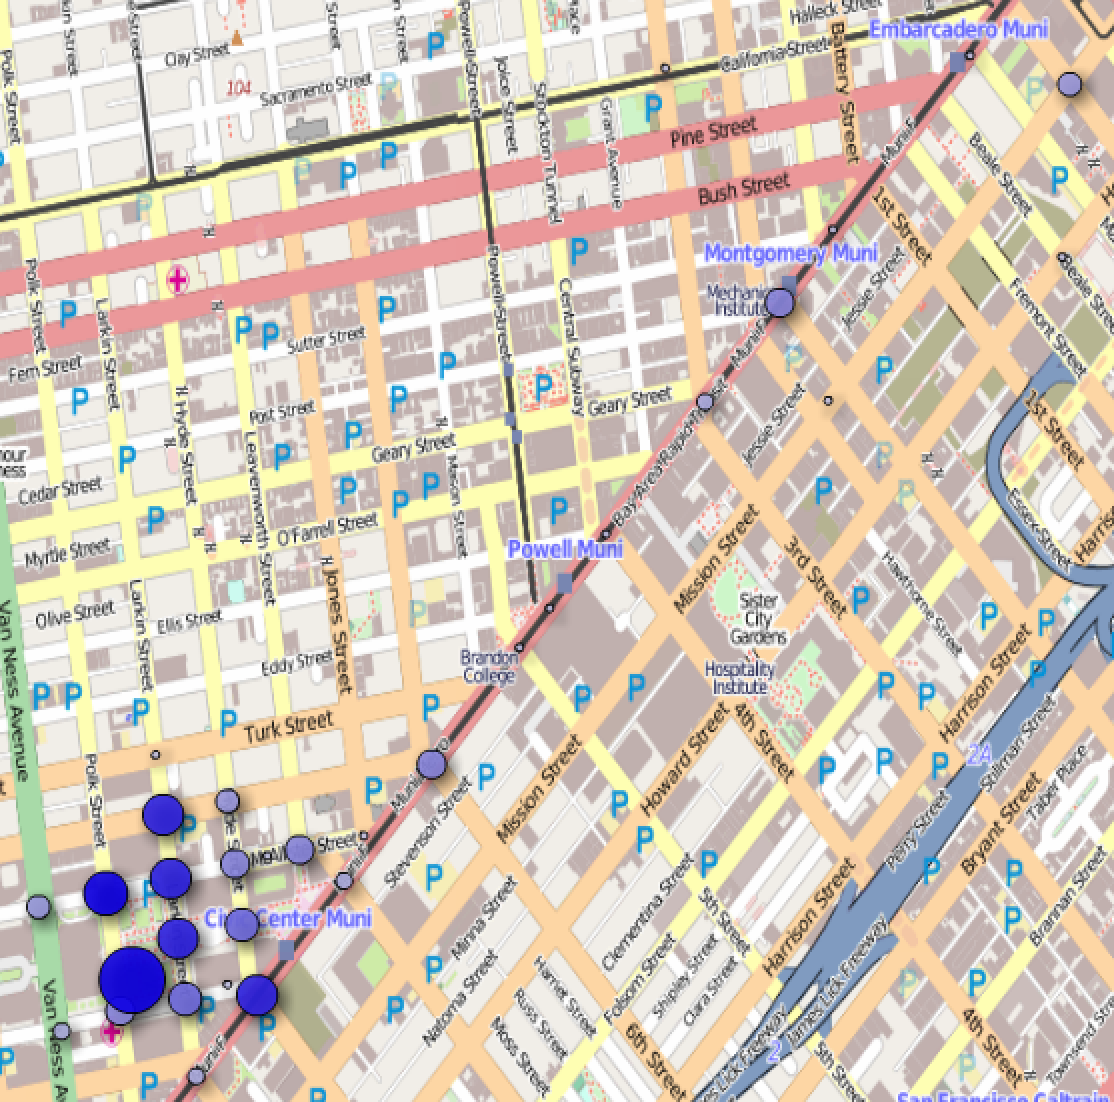
The following chart shows call-load by location:
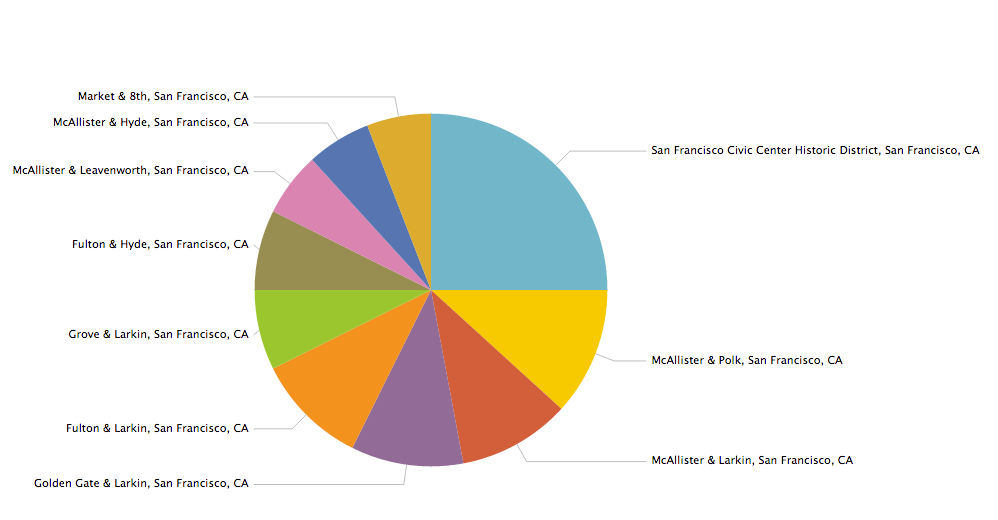
| Location | Calls | Percent of Calls |
|---|---|---|
| Civic Center | 17 | 15% |
| McAllister & Polk | 8 | 7% |
| McAllister & Larkin | 7 | 6% |
| Golden Gate & Larkin | 7 | 6% |
| Fulton & Larkin | 7 | 6% |
| Grove & Larkin | 5 | 4% |
| Fulton & Hyde | 5 | 4% |
| McAllister & Leavenworth | 4 | 3% |
| McAllister & Hyde | 4 | 3% |
| Market & 8th | 4 | 3% |
| Market & 2nd | 4 | 3% |
| Grove & Polk | 4 | 3% |
| Mission & Spear | 3 | 3% |
| McAllister & Van Ness | 3 | 3% |
| Golden Gate & Hyde | 3 | 3% |
| Market & Taylor | 2 | 2% |
| Market & Larkin | 2 | 2% |
| Market & 7th | 2 | 2% |
| Market & 3rd | 2 | 2% |
| Grove & Van Ness | 2 | 2% |
| Fulton & Leavenworth | 2 | 2% |
Author
This report was compiled on Monday, July 9th, 2013 by Greg Albrecht, Dispatch Supervisor, Rock Medicine Pride 2013.